

The active and inactive employee overview charts in Stafiqo provide a clear visual representation of your company’s workforce distribution, active user metrics, and account status updates across all registered organizations.
To review the active and inactive employee overview charts
Open the Stafiqo application and log in to your account.
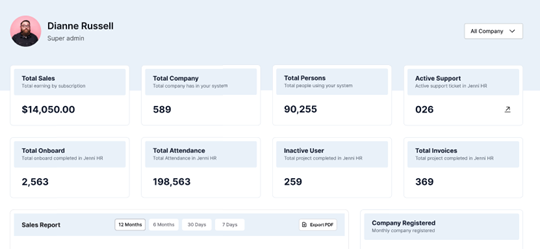
Locate the main overview summary widgets near the top of the dashboard to view high-level counts:
- Total Persons: View the total number of people using the system.
- Inactive User: Review the count of inactive accounts across the system.
Scroll down to the overview analytics and chart section to review detailed breakdowns:
- Company Status Chart: Inspect the categorized tabs for All, Active, Blocked, and Deleted accounts to analyze current active versus inactive company profiles.
- Monthly Activity / Registration Reports: Review line or bar graphs depicting company registration trends and user activity fluctuations over specific time intervals (e.g., 12 Months, 6 Months, 30 Days, 7 Days).
To filter or export data, click the Export PDF button or use the date/range filter controls located at the top of the chart card.
Click on any specific status category (e.g., Active or Blocked) to view the filtered list of individual users or companies associated with that status.
Note: Inactive accounts include blocked profiles, deleted users, or dormant company registrations. Hover over chart data points to view precise numerical values.